File:Compressibility Factors.png
From Knowino

No higher resolution available.
Compressibility_Factors.png (194 × 276 pixels, file size: 4 KB, MIME type: image/png)
[edit] Summary
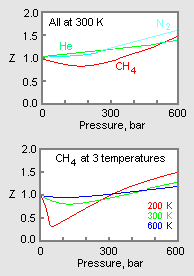
Graphs of compressibility factor Z. Upper graph has 3 single gas examples. Lower graph shows how temperature affects Z value of a single gas. Citizendium author: Milton Beychok 01:15, 18 March 2008 (CDT)
[edit] Licensing
| |
This work is in the public domain. This may be because its copyright term has expired, or because the copyright holder has explicitly waived all legal rights to the work. |
File history
Click on a date/time to view the file as it appeared at that time.
| Date/Time | Thumbnail | Dimensions | User | Comment | |
|---|---|---|---|---|---|
| current | 12:20, 26 July 2011 | | 194×276 (4 KB) | Paul Wormer (talk | contributions) | (Graphs of compressibility factor Z. Upper graph has 3 single gas examples. Lower graph shows how temperature affects Z value of a single gas. Citizendium author: Milton Beychok 01:15, 18 March 2008 (CDT) ) |
- Edit this file using an external application (See the setup instructions for more information)
File links
The following page links to this file: