File:Vapor Pressure Chart.png
From Knowino
No higher resolution available.
Vapor_Pressure_Chart.png (400 × 528 pixels, file size: 8 KB, MIME type: image/png)
Summary[edit]
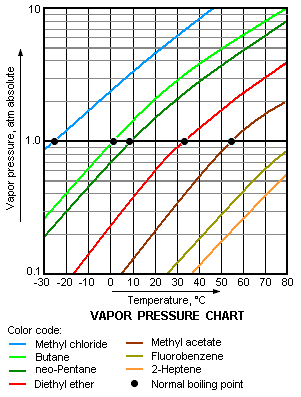
| Description |
This image is a chart of vapor pressure versus temperature, for various liquids. The chart's y-axis is logarithmic and the x-axis is linear. It includes data for Propane, Methyl chloride, Butane, neo-Pentane, Diethyl ether, Methyl acetate, Fluorobenzene, and 2-Heptene. |
| Date | |
| Source | Own work |
| Author | Mbeychok |
 |
This graph image could be recreated using vector graphics as a SVG file. This has several advantages; see Commons:Media for cleanup for more information. If an SVG form of this image is available, please upload it and replace afterwards this template with {{Vector version available|new image name.svg}} or just {{NowSVG}}. |
Licensing[edit]
| I, the copyright holder of this work, release this work into the public domain. This applies worldwide. In some countries this may not be legally possible; if so: I grant anyone the right to use this work for any purpose, without any conditions, unless such conditions are required by law.
|
File history
Click on a date/time to view the file as it appeared at that time.
| Date/Time | Thumbnail | Dimensions | User | Comment | |
|---|---|---|---|---|---|
| current | 00:03, 11 June 2014 | | 400×528 (8 KB) | Materialscientist | (scaling issues) |
File links
The following 2 pages link to this file: