File:Blastcurves 1.png
This file is from a shared repository and may be used by other projects. The description on its file description page there is shown below.
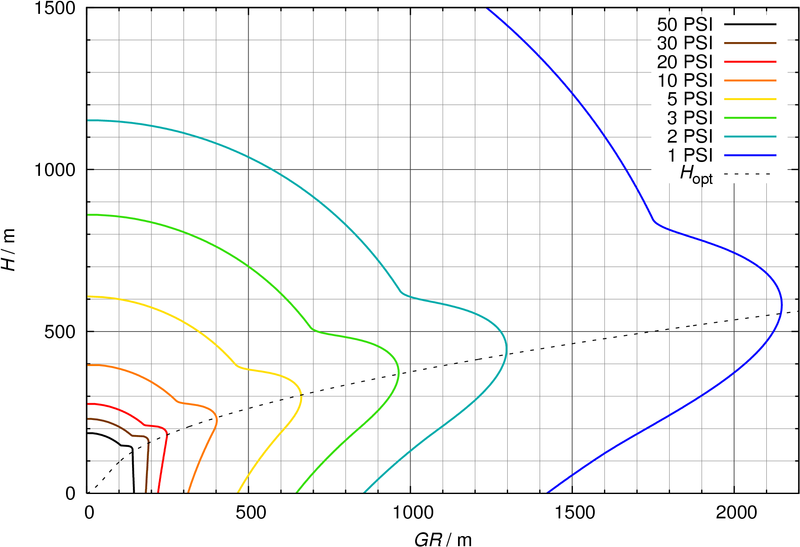
- Beschreibung: Abhängigkeit des Überdrucks einer 1-Kilotonnen-Explosion von Entfernung und Detonationshöhe.
- Autor: SiriusB
- Quelle: Erzeugt mit Gnuplot und selbstgeschriebenem Programm anhand im Artikel Atombombenexplosion angegebener Quellen.
- Description: Overpressure ranges from 1 to 50 PSI of a 1 kiloton air burst as a function of burst height. The thin black curve indicates the optimum burst height for a given ground range.
- Author: SiriusB
- Sources: Plotted with Gnuplot. Isobars are based on numerically solved formulae from the internal help pages of the BLAST software, the H_opt curve is an analytical fit using the inversely plotted formula
This function should fit both BLAST output and Figures 3.73a-c taken from Glasstone, Dolan, The Effects of Nuclear Weapons, 1977 (EoNW77) as a compromise. Both sources differ slightly. EoNW77 shows the maximum low-pressure ranges at somewhat lower altitudes whereas for high pressures >40 psi BLAST shows no optimum altitudes at all (see the innermost isobar). However, since numerical fitting of curves taken from a paper would be a Sisyphean task while BLAST already outputs plottable numbers, only isobars from the latter are plotted here.
- Additional note: First image moved from German Wikipedia to Commons. New version created on Feb. 4 2005 with higher quality (saved and edited as Postscript with Gnuplot, then converted to higher quality PNG via GIMP).
Licensing[edit]
|
I, the copyright holder of this work, hereby publish it under the following licenses:
You may select the license of your choice.
|
File history
Click on a date/time to view the file as it appeared at that time.
| Date/Time | Thumbnail | Dimensions | User | Comment | |
|---|---|---|---|---|---|
| current | 10:24, 4 February 2005 |  | 1,902×1,300 (104 KB) | SiriusB | (Better quality) |
File links
The following page links to this file:


