 a contour plot ( See CONTOUR )
a three dimensional plot ( See 3D )
a space plot ( See SPACE and TRAN)
a contour plot ( See CONTOUR )
a three dimensional plot ( See 3D )
a space plot ( See SPACE and TRAN)
FILES
MOLDEN reads three sort of files, these are:Inputfile
File holding the title and keyword lines ( FORTRAN unit 5 )
GAMESS/GAUSSIAN Outputfile
A file produced by running GAMESS/GAUSSIAN. The name of this file must be defined with the keyword FILE . This must be the output of a single GAMESS/GAUSSIAN run. Care must be taken not to turn off printing of vectors and/or basis set in the case of GAMESS. In the case of GAUSSIAN printing of basis set information has to be turned on by the use of the keyword GFINPUT. Printing of SCF convergence is switched on by use of #P Printing of MO coefficients has to be turned on by use of the keyword IOP(6/7=1) for GAUSSIAN92 and older or IOP(6/7=3) for GAUSSIAN94. ( FORTRAN unit 30 )
MOPAC .GPT files
A file generated by MOPAC/AMPAC when using the keyword GRAPH. It contains density information.
MOLDEN writes two files, these are:
Outputfile
Results file. ( FORTRAN unit 6 )
plotfile
The Plotter/Screen File called plot ( FORTRAN unit 15 ). At the end of the MOLDEN run, a Screen file can be displayed by :
- simply typing 'CAT PLOT' on Unix machines 'TYPE PLOT.DAT' on VAX machines
Depending on the configuration of the Plotter, the Plot file can be displayed in the same way or has to be sent to a queue ( usually by a SUBMIT command or an lpr command ).
INPUTFILE
The layout of Inputfile for a MOLDEN job is as follows;
<Title line> ( 80 columns maximum ) <First line of key words> ( 80 columns maximum ) <Second line of key words> ( 80 columns maximum )
Both capitals and lowercase can be used. The keywords taking no parameters usually can be abbreviated to four characters.
SPECIFICATION_OF_TERMINAL/PLOTTER_TYPE
The following commands specify which terminal or plotter driver is to be used.TEK4014
Syntax: TEK4014
The Tektronix4014 graphics language is considered to be something of a standard. A lot of graphical terminals can emulate tek4014 although you probably need to tell your terminal it is to do so. Some PC's having a VT100 terminal emulation can also emulate tek4014 (it runs at least on an ATARI and in an impaired way on a Macintosh) (some HP terminals with a tek4014 emulation run tek4014 faster than the HP language) XWINDOWS has an application xterm in which you can turn on a tek window. (Under Unix this command is usually located in the directory /usr/bin/X11)
Syntax: HPGL
HPGL stands for Hewlett Packard Graphics Language. The HP plotters all speak this language. Also HP laserwriters understand HPGL.
Syntax: HP2392A
Most HP terminals with graphics capability probably will be able to understand these escape codes.
Syntax: POSTSCRIPT
Most Laserwriters understand POSTSCRIPT. Although sometimes you have to tell them it is not getting plain text but POSTSCRIPT.
Syntax: XWINDOWS
Most workstations have XWINDOWS capability (See section INSTALLATION GUIDE how to install MOLDEN with an XWINDOWS driver). Before running MOLDEN you have to define the display you will be working on. On Unix machines just type; SETENV DISPLAY :0 when you want to use the display of the machine MOLDEN is executing on, and for instance SETENV DISPLAY CAMMS3.CAOS.KUN.NL:0 when you want to use the display of the remote machine with internet address CAMMS3.CAOS.KUN.NL. On VAX machine, the same is accomplished by typing SET DISPLAY/CREATE /NODE=CAMMS3.CAOS.KUN.NL/TRANS=TCPIP. A window will be created at run time, holding the picture. A rectangular part of this picture can be magnified by pressing the left mouse button and holding it down while dragging it untill the rectangle has the required size. Pressing the middle mouse button subsequently will undo the magnification. Pressing the right mouse button will end the MOLDEN session. When the cursor is in the MOLDEN window, the arrow keys can be used to rotate the 3-d picture and I and D keys will respectively Increase and Decrease the vertical scale op the 3-d plot. The letter M is a toggle, which turns on/off the displaying of the molecule in the 3-d picture.
Syntax: FIGURE
Figure is a Graphics language developed by the Genetics Computer Group. With it goes a package that can convert Figure to a variety of graphics/plotter languages.
Syntax: SILLY
The Silicon Graphics 3D version is requested through the use of the keyword SILLY. This is an experimental version. (See section INSTALLATION GUIDE on how to install this version.)
Syntax: VRML/VRML2.0
With this keyword you request to write out a Vertual Reality Modelling Language file (default: molden.wrl)
Syntax: POVRAY
With this keyword you request to write out a POVRAY rayshading file (default: molden.pov)
DEFINITION_OF_PLOTFUNCTION
The following keys define ;whether the total electron density has to be plotted or the sum of the density owing to some specified molecular orbitals. (OCCU, VALENCE)
whether the electron density or the value of an molecular orbital itself has to be plotted (HOMO, LUMO, PSI, PHASE)
whether the molecular density minus spherically averaged atomic density has to be plotted (BONDS) or whether for O,F,S and Cl oriented ground state atomic densities have to be substracted. (BONDS in combination with ORIENT)
whether the interatomic overlap density has to be plotted (OVERLAP) or the atomic part of difference density (ATOMIC). These are the two components that make up the density matrix used by BONDS (possibly in combination with ORIENT)
whether the electrostatic potential derived from charges is to be plotted. (CHPOT)
whether the electrostatic potential derived from a DMA (Distributed Multipole Analysys) calculation is to be plotted. (MOLPOT)
whether the ab initio electrostatic potential (GAMESS/GAUSSIAN) is to be calculated and displayed (ELPO)
whether the laplacian of the electron density (GAMESS/GAUSSIAN) is to be calculated and displayed (LAPLACIAN)
Syntax: ATOMIC
Specifies that the electron density of the free atoms is to be subtracted from the molecular electron density as with the use of the keyword BONDS, only now the contribution from the interatomic overlap is set to zero. In fact the density matrices used by ATOMIC and OVERLAP together make up the density matrix used by BONDS. The density map predominantly will have a negative value, since some of the atomic density has been transferred to interatomic overlap density. However lone pairs usually show up as positive contributions in the density map. (As with BONDS it can be used in combination with the keyword ORIENT)
See also BONDS, ORIENT and OVERLAP !!
Syntax: BONDS
Not to be used in conjunction with HOMO, LUMO, PSI or OCCU. BONDS subtracts the spherically averaged atomic density from the molecular density . The result is a plot whose average value is zero, and shows where the electrons have come from and gone to when the bonds are formed. However a problem can arise. Most atomic ground states are not spherically symmetric. Oxygen for example has a 3P ground state f.i. Px2Py1Pz1. The electron density now is maximal along the x-axis, so that in fact when an atom in the molecular environment has retained a lot of its ground state character it will have a preferable orientation. Subtracting a spherically symmetric atom Px4/3Py4/3Pz4/3 in this case can result in subtracting too much in the y and z directions and too little in the x direction. As a result the density difference plot may show a misleading decrease in electron density along for example a C-O axis. In this case the keyword ORIENT must be used.(See also ORIENT, OVERLAP and ATOMIC) This effect is usually most pronounced for the atoms O,F,S, and Cl, whereas for example Carbon in the molecular environment usually has a lot of spherically symmetric character.
BONDS can only be used when one of the following basissets have been employed; STO3G, 3-21G, 4-31G, 6-31G, optionally with polarisation functions ( *, or ** ). They may differ per atom however and the atoms must be in the range Hydrogen up to Chlorine.
HINT : for contour plots CUT=0.1 is recommended for 3d plots MULT=20 is recommended
Syntax: HOMO
For closed-shell systems with non-degenerate Highest Occupied Molecular Orbitals, the keyword HOMO can be used to produce an intensity map of the highest occupied molecular orbital. For other systems, the keyword PSI should be used.
Syntax: LUMO
For closed-shell systems with non-degenerate Lowest Unoccupied Molecular orbitals, the keyword LUMO can be used to produce an intensity map of the lowest unoccupied molecular orbital. For other systems, the keyword PSI should be used.
Syntax: for example; OCCU = (1-22/0,9/1.0,10/2 )
When the user wants to explicitly define an electronic configuration for a system, overriding the occupancies read in from the GAMESS/ GAUSSIAN output file, the keyword OCCU has to be used. Taking the occupancies read in from the outputfile as a starting point, the orbital occupancies in the example are modified in the following way, in sequential order;
ORBITAL OCCUPANCY
1-22 0 9 1 10 2
For the use with Unrestricted Hartree Fock wavefunctions the keywords OCCA (for the alpha electrons) and OCCB (for the beta electrons) have to be used.
Syntax: ORIENT or ORIENT = (n1,n2/n.nn/n.nn,...)
To be used in conjunction with the keyword BONDS and not to be used in conjunction with HOMO, LUMO, PSI or OCCU. BONDS subtracts the the spherically averaged atomic density from the molecular density . The result is a plot whose average value is zero, and shows where the electrons have come from and gone to when the bonds are formed. However a problem can arise. Most atomic ground states are NOT spherically symmetric. Oxygen for example has a 3P ground state f.i. Px2Py1Pz1 the electron density now is maximal along the x-axis ,so that in fact when an atom in the molecular environment has retained a lot of its ground state character it will have a preferable orientation. Subtracting a spherically symmetric atom Px4/3Py4/3Pz4/3 in this case can result in subtracting too much in the y and z directions and too little in the x direction. As a result the density difference plot may show a misleading decrease in electron density along for example a C-O axis. This effect is usually most pronounced for the atoms O,F,S, and Cl, wheras for example Carbon in the molecular environment usually has a lot of spherically symmetric character.
When using ORIENT without parameters, the atomic density (DATOM) of O,F,S and Cl atoms will be oriented in such a way that the sum of (DMOL(i,j)-DATOM(i,j))2 (delta squared on the output file) is at a minimum. (DMOL being the atomic part of the molecular density matrix and i and j run over the Px,Py,Pz Atomic orbitals). This is done per atom.
When using ORIENT = (N1,N2,..) only the specified atoms are oriented. For all others the spherically averaged atomic density is used. Checked is whether atom number N1,N2 etc are O,F,S or Cl atoms.
When using ORIENT = (N1,N2/N.NN/N.NN,...) the automatic orientation mechanism is overridden for atom N2. Instead it is oriented using the two angles supplied on the keyword after the slashes (alfa and beta on the output file). For example the atomic ground state density of Oxygen has an oval symmetry, having one direction in which 2 electrons participate and two perpendicular directions in which 1 electron each participates. The supplied angles define the direction of the unique axis. If the atom in the molecular environment has lost a lot of its ground state character the automatic orientation mechanism can give physically meaningless orientations. In the ultimate case when the oxygen has a pure spherical O2- character, the use of oriented ground state densities is clearly erroneous. When the atomic part of the molecular density matrix shows one direction in which 1 electron participates and two directions in which 1.5 electrons each participate, the automatic orientation mechanism may provide a direction which results in a decrease in electron density at the middle of a bond axis. Here orientation by hand can result in a density-difference plot with the expected increase in electron density at the middle of a bond axis.
ORIENT can only be used when one of the following basissets have been employed ; STO3G, 3-21G, 4-31G, 6-31G optionally with polarisation functions (*, or **). They may differ per atom however and the atoms must be in the range Hydrogen up to Chlorine.
HINT : for contour plots CUT = 0.1 is recommended for 3d plots MULT = 20 is recommended
(see also Chemical Deformation Densities, W.H.E. Schwarz, K. Ruedenberg and L. Mensching, J. Am. Chem. Soc. 1989,111,6926-6933, where the orientation used here is termed 'naive' )
Syntax: OVERLAP
The interatomic overlap density will be plotted. This is done by setting the atomic part of the Molecular density matrix to zero. The density map will predominantly have positive values with maxima roughly at midway the bond axes.
Syntax: PHASE
PHASE is used to to reverse the sign of a Molecular Orbital. Used in conjuction with PSI.
Syntax: PSI = NN ( = -NN for UHF beta orbitals )
A specified molecular orbital is to be plotted (see also PHASE).
Syntax: VALENCE
Since the inclusion of non-valence electrons in ab initio calculations results in the predominance of the inner shell electron density on the total electron density, the interpretation of the chemically more interesting valence electron density is clouded. The use of VALENCE results in non occupying those molecular orbitals which predominantly contain inner-shell electron density. It only works when your molecule exclusively consists of atoms from H to Ar. Otherwise you should use the keyword OCCU.
Syntax: CHPOT
If a molecule comes with partial supplied the charges derived electrostatic potential is calculated
Syntax: MOLPOT
In a Distributed Multipole Analysis the molecular electron density and atomic charges are fitted by an expansion of multipoles. With these multipoles the electrostatic potential of a point charge in the field of the molecule can be calculated and plotted.
(see A.J. Stone and M. Alderton, Molecular Physics, 1985, 56, 1047-1064)
Syntax: RDMULT
This keyword can only be used when the output of a DMA analysis by GAMESS is supplied. In a Distributed Multipole Analysis the molecular electron density and atomic charges are fitted by an expansion of multipoles. With these multipoles the electrostatic potential of a point charge in the field of the molecule can be calculated and plotted.
(see A.J. Stone and M. Alderton, Molecular Physics, 1985, 56, 1047-1064)
Syntax: ELPO
Triggers the calculation of the ab initio electrostatic potential (ONLY for GAMESS and GAUSSIAN).
Syntax: LAPLACIAN
Triggers the calculation of the laplacian of the electron density (ONLY for GAMESS and GAUSSIAN).
Syntax: ELF
Triggers the calculation of the Electron Localisation Function (ELF)
Syntax: LOCAL
Triggers the transformation of the occupied orbitals to set of localised orbitals (after a scheme by BOYS).
Syntax: SPINDENS
Triggers the calculation of spin density. Use in combination IPSI=0. Effectively subtracts the density matrix for the alpha orbitals from that of the beta orbitals.
DEFINITION_OF_THE_PLOTPLANE
The plane of the plot is essentially defined by :The center of the plot ((PX,PY,PZ) on the MOLDEN outputfile )
The vector perpendicular to the plane of the plot ((CX,CY,CZ) on the MOLDEN outputfile )
The EDGE keyword specifying the size of the square plot
The center and vector perpendicular to the plane of the plot can either be specified ;
directly in cartesian coordinates by using the absolute form of the keywords CENTER and LINE.
indirectly, by using the coordinates of the atoms on the PLANE and ROT keywords ( or the atomic form of the keywords CENTER and LINE).
The use of CENTER/LINE and PLANE(/ROT) are mutually exclusive. Of these, the PLANE(/ROT) keywords are the most flexible and easy to use. PLANE defines the plane of the plot by specifing three atoms and optionally this plane can then be rotated round the axis formed by two of these three atoms by use of the keyword ROT. The remaining atom will then no longer lie in the plane of the plot.
Finally, when having defined the plane of the plot by either CENTER/LINE or PLANE(/ROT) the plane can be translated along the vector perpendicular to the plane by use of the keyword LIFT.
Syntax: PLANE = (N,N,N)
This keyword is essential, it defines the plane of the plot. For example PLANE=(1,2,3) means the first three atoms in the coordinate list define the plane of the plot. The center of the triangle will be taken as center of the plot. The keywords CENTER/LINE and PLANE are mutually exclusive.
Syntax: ROT = (N,N,NNN.NN)
This keyword is optional, it can only be use in conjunction with the keyword PLANE. For example, when previously having defined the plane of the plot by the first three atoms (PLANE=(1,2,3) ), this plane can be rotated round the axis formed by atoms 2 and 3 by 45 degrees, by using ROT=(2,3,45.0), atom 1 will now no longer be part of the plane of the plot . The center of the plot has been shifted to the point midway the line connecting atoms 2 and 3.
Syntax: CENTER = NN or CENTER = (N.NN,N.NN,N.NN)
This keyword is essential, it defines the center of the plot Two formats are provided to define the center: (A) an atom number can be used, and (B) an absolute cartesian coordinate can be specified. Irrespective of which option is used, the center of the plot will be converted internally into absolute cartesian coordinates.
Atomic
Syntax: CENTER = N. The location of atom N is defined as the center of the plot. Thus if atom n has cartesian coordinates (x=0.5, y=1.4, z=-0.8) then the center of the plot is (x=0.5, y=1.4, z=-0.8). Dummy atoms are not counted, so if any dummy atoms were used in the definition of the geometry, the atoms will have been renumbered (see the MOLDEN output file; coordinates section for the new numbering )
Absolute
Syntax: CENTER = (N.NN,N.NN,N.NN) .The location of the center of the plot is defined as being (n.nn,n.nn,n.nn). Of course, before such a center can be defined, the user must know the cartesian coordinates of the atoms in the molecule.
Syntax: LINE = NN or LINE = (N.NN,N.NN,N.NN)
This keyword is essential, it defines a vector perpendicular to the plane of the plot. Two formats are provided to define the axis perpendicular to the plane of the plot. These formats use radically different concepts, so users are cautioned to verify that they understand both definitions, and the distinction between them. (A) an atom number can be used, and (B) an absolute cartesian coordinate can be specified. Irrespective of which option is used, the axis of the plot will be converted internally into a unit vector in cartesian coordinates.
Atomic
Syntax: LINE = N The axis of the plot is defined by the vector drawn from atom N to the defined center of the plot. Thus if atom n has cartesian coordinates (x=0.5, y=1.4, z=0.2) and the center of the plot is at point (x=0.5, y=1.4, z=-0.8) then the axis of the plot is (0.0, 0.0, 1.0). Dummy atoms are not counted, so if any dummy atoms were used in the definition of the geometry, the atoms will have been renumbered (see the MOLDEN output file, coordinates section for the new numbering )
Absolute
Syntax: LINE = (N.NN,N.NN,N.NN) The axis of a line perpendicular to the plane of the plot is (n.nn,n.nn,n.nn). This axis need not be normalized, but must be finite, that is the only axis not allowed is (0,0,0).
Syntax: LIFT = N.NN
This keyword is optional. When having defined the plane of the plot by either CENTER/LINE or PLANE(/ROT) the plane can be translated along the vector perpendicular to the plane by use of the keyword LIFT. The length of this vector is specified as N.NN Atomic Units.
Syntax: EDGE = N.NN
The length of the sides of the graph-plot is defined as being n.nn Atomic Units (1 AU = 0.529177 Angstrom).
Syntax: EDX = N.NN
The length of the X,Y or Z side of the graph-plot is defined as being n.nn Atomic Units (1 AU = 0.529177 Angstrom).
Syntax: NPTSX = N
The number of points in the X,Y or Z direction of three dimensional grid.
Syntax: ALIGN
This keyword finds the center of the molecule and finds reasonable values for the EDGE variable. Very handy in combination with SPACE type plots.
DEFINITION_OF_THE_PLOTTYPE
Three kinds of plots are possible;
a contour plot ( See CONTOUR )
a three dimensional plot ( See 3D )
a space plot ( See SPACE and TRAN)
Syntax: CONTOUR
The use of CONTOUR requests a contour plot. This is the default, so that its specification is not required, except when the combination of a 3-D grid plot with a contour plot is desired. (See also CUT, FINE and STEP .)
Syntax: CUT = N.NNN
This keyword sets the maximum contour value at n.nnn times the maximum encountered density/intensity. CUT should be within the range 0.0 - 1.0. This keyword was specially devised for use with gaussians since the inclusion of non-valence electrons in ab initio calculations results in the predominance of the inner shell electron density on the total electron density, which clouds the interpretation of the chemically more interesting valence electron density.
Syntax: FINE
Normally between 10 and 25 contours are plotted. In order to increase this number FINE can be used, in which case 40 to 100 contours will be generated.
Syntax: STEP = N.NN
Normally between 10 and 25 contours are plotted. The program itself figures out which contour interval should be used. Sometimes the program comes up with different contour intervals for plots one would like to compare. In this case STEP should be used to force a contour interval used by previous runs.
Syntax: 3D
3D can be used to create a 3-D mesh of lines plot. 3D can be used in conjuction with the keyword AXIS specifying the view direction. When AXIS is omitted a value of 0.5 is used. 3D can also be used in combination with CONTOUR. (See also AXIS and MULT)
Syntax: AXIS = N.NNN
AXIS determines the view direction when a three dimensional plot is requested by the use of the keyword 3D. The range of n.nn in AXIS = N.NN is 1.0 to 0.0. Where 1.0 would give a square plot, as if the user was viewing the plot from directly overhead looking straight down, 0.0 gives a view of the plot as if the user was looking at it from the horizon, looking horizontally. Clearly, AXIS=1.0 would not show the relief. If 3D was used only a perfectly square grid would be seen. A better choice would be AXIS = 0.6. Conversely, AXIS = 0.0 would show the contours as straight lines (as they would be being viewed edge-on).
Syntax: MULT = N.NN
There is a default scale for the relief of a plot, when viewed as a 3-D structure. If this default is not suitable, say the plot is too flat, then MULT = N.NN can be used to change the vertical scale. MULT=1.0 will do nothing, MULT = 2.0 will increase the vertical relief. Use in conjunction with the keyword 3D. (See also 3D and AXIS)
Syntax: MAXM
Plot the maximum and minimum Plot Function value at the grid points. (ONLY with 3D and CONTOUR plots)
Syntax: SPACE = N.NN
An isopotential surface is displayed. The value of the Plot Function has to be supplied with the SPACE keyword. The best strategy here is to first do a CONTOUR plot and from that select a suitable contour value. Default for Xwindows and PostScript is to plot a solid surface. A transparent surface can be requested through the use of the keyword TRAN.
Syntax: TRAN
Display a transparent surface when displaying a SPACE type of plot.
To create basisset difference plot, first read GAMESS/GAUSSIAN output file containing basis set #1 into molden. Then click the Write Grid button or use the keyword WRBAS. This will create a file with the name gridfile. Secondly, start a new molden session and read in the GAMESS/GAUSSIAN output file containing basis set #2. Then click the Read Grid button or use the keyword RDBAS. Checked is wether both calculations have the save geometry.
Syntax: WRBAS WRBAS=filename
Write out a file called "gridfile" (default) or "filename" when given, containing the plotfunction values for a certain basis set. Write out a file called '3dgridfile' (default) or "filename" when used in combination with the SPACE keyword. (See BASISSET_DIFFERENCE_MAPS and RDBAS)
Syntax: RDBAS RDBAS=filename
Read from a file called "gridfile" (defualt) or "filename" the plotfunction values for a certain basis set to be subtracted from the current. Alternatively, read from a file called "3dgridfile" (default) or "filename" to subtract from a 3D SPACE plot. (See BASISSET_DIFFERENCE_MAPS and WRBAS)
Syntax: BEFORE
In case GAMESS/GAUSSIAN has performed a geometry optimise/saddle run, two sets of vectors are available from the outputfile, those before optimisation and those after. Specifying BEFORE results in using the vectors and geometry before optimisation.
Syntax: DEBUG
This keyword is in fact a way of getting a lot more output, such as: basis set information, vectors, density matrices and so on.
Syntax: FILE = filename
This keyword must be used to specify the GAMESS/GAUSSIAN outputfile from which is read. This must be the output of a single run and care must be taken not to turn off printing of vectors.
(When using the keyword MOLPOT the output of a DMA analysis by GAMESS is expected, without the output of the corresponding startup job.)
Syntax: GENERATE
This keyword results in the writing of the density matrix in FORTRAN data statements. It is used to generate atomic data for use by the program internally. (of course a preceding atomic run by GAMESS has to be performed, do not use with a GAUSSIAN outputfile )
Syntax: GENAT
Molden has capability to write and read files with custom spherical atom densities to be used in difference density plots (see: bonds keyword). molden inputfile inputfile: some title file=gaussian_atomic.log genat A file 'basiinf.mbi' will be written, these can be concatenated into a file called 'atomicdens' and read back in to molden, fi: molden -x atomicdens Thanks to Bjoern Pedersen who implemented it.
BASIS SET EFFECTS
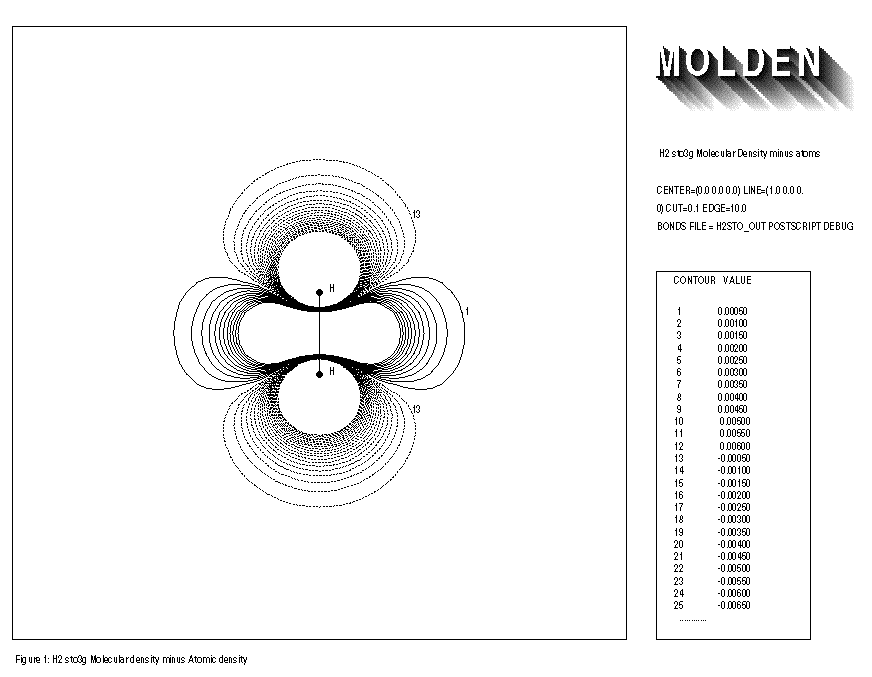
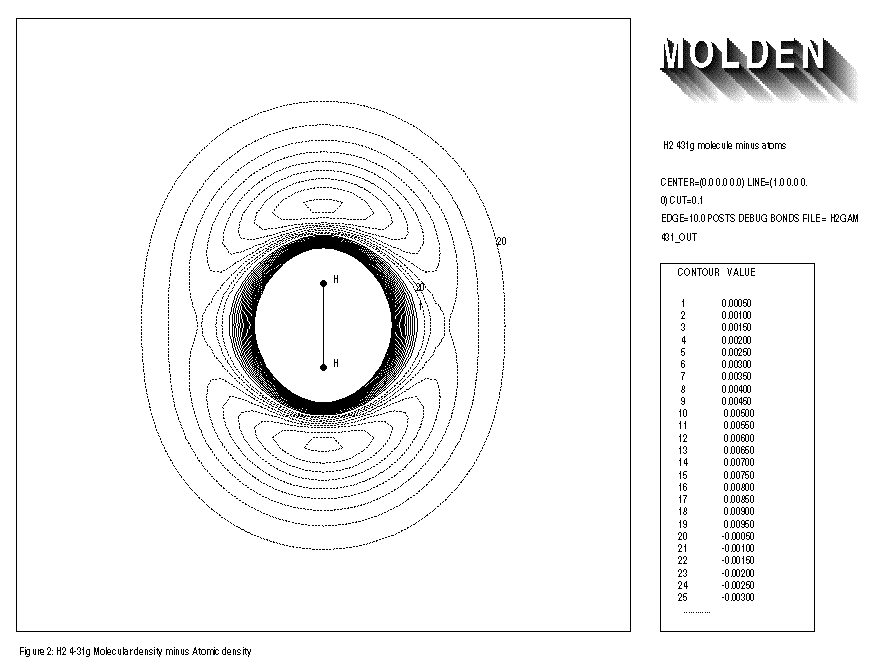
When using the minimal basis set STO3G together with the BONDS option and comparing the electron density of the free atoms with that of the molecule, one usually finds an increase of electron density at the middle of the bonds axes and a decrease of electron density at the atoms themselves. Doing the same for the split-valence basis sets, such as 3-21G, 4-31G and 6-31G, one also finds an increase of electron density at the middle of the bond axes, but also an increase of electron density close to the atom centres themselves is observed. A decrease of electron density is found in the outer regions of the molecule. This reflects the capability of the split-valence to yield a more contracted atom on going from the free atoms to the molecule. The minimal STO3G basis set clearly does not have this flexibility. This effect is illustrated for the Hydrogen molecule with STO3G and 4-31G basis sets. (See FIGURE 1 and FIGURE 2 respectively)
Inputfile:
1: H2 sto3g Molecular Density minus atoms 2: CENTER=(0.0,0.0,0.0) LINE=(1.0,0.0,0.0) CUT=0.1 EDGE=10.0 3: BONDS FILE=h2stoout POSTSCRIPT DEBUG
Inputfile:
1: H2 4-31g molecule minus atoms 2: CENTER=(0.0,0.0,0.0) LINE=(1.0,0.0,0.0) CUT=0.1 3: EDGE=10.0 POST DEBUG BONDS FILE=h2gam431out
RING STRAIN
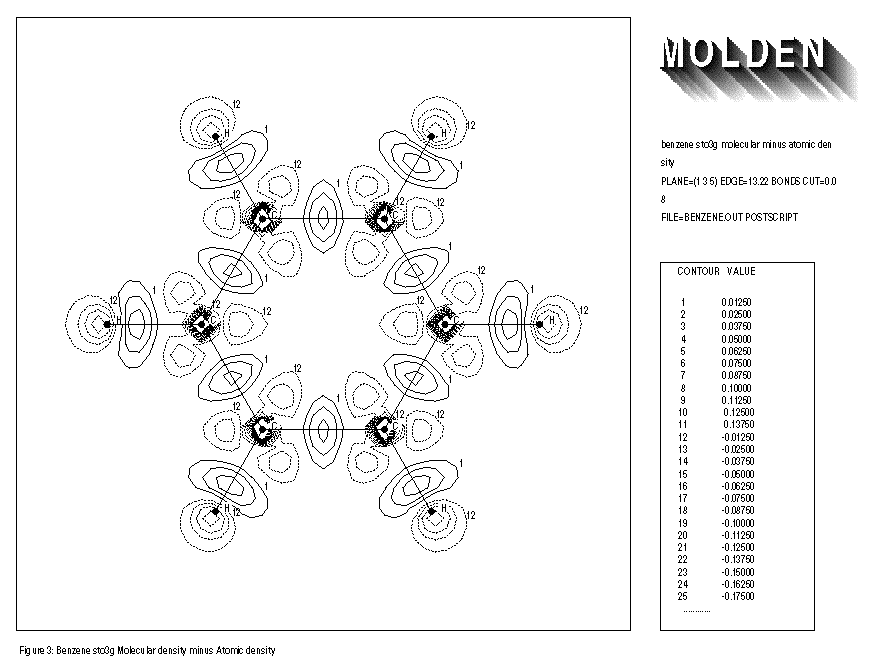
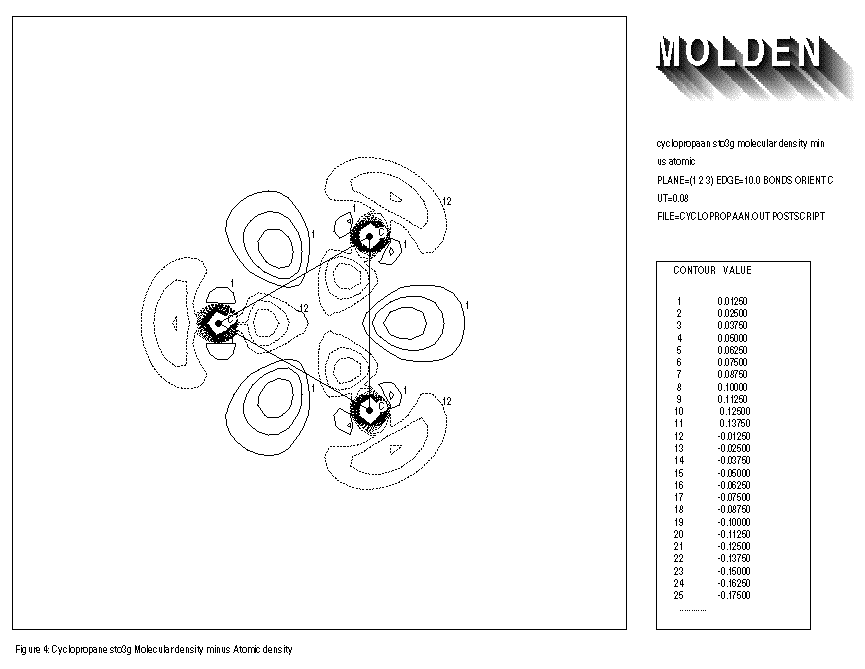
FIGURE 3 shows the electron density of the benzene molecule minus that of the free atoms. An increase of electron density at the middle of the C-C bond axes is observed. FIGURE 4 shows the result of the same procedure followed for the cyclopropane molecule. Here the increase of electron density is clearly positioned outside the C-C bond axes. The overlap of atomic orbitals of the different C atoms is not optimal because of ring-strain. This effect is also known as the formation of banana bonds in cyclopropane.
Inputfile:
1: benzene sto3g molecular minus atomic density 2: PLANE=(1,3,5) EDGE=13.22 BONDS CUT=0.08 3: FILE=benzene.out POSTSCRIPT
Inputfile:
1: cyclopropane sto3g molecular density minus atomic 2: PLANE=(1,2,3) EDGE=10.0 BONDS CUT=0.08 3: FILE=cyclopropaan.out POSTSCRIPT
THE USE OF KEYWORD ORIENT
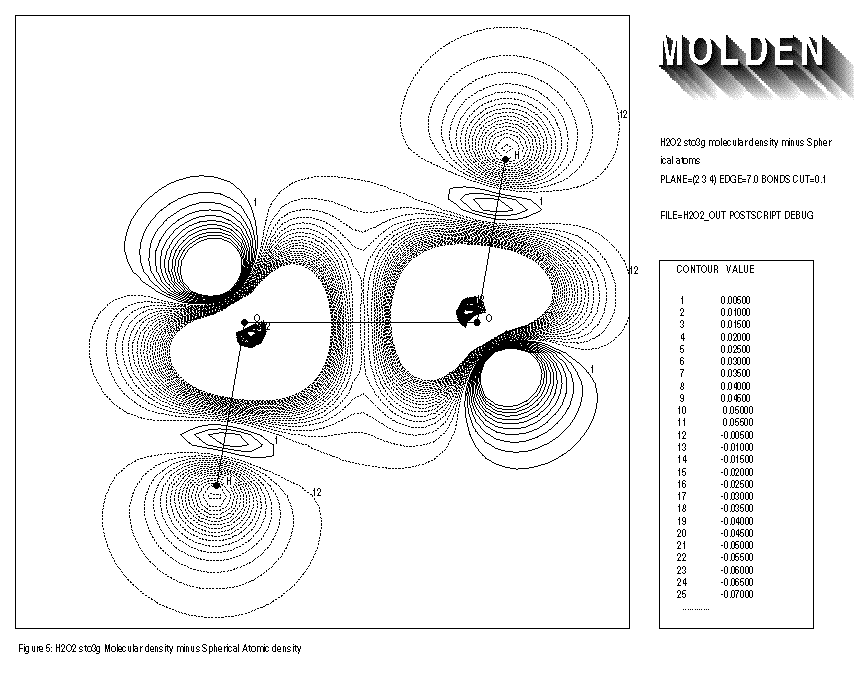
When using the keyword BONDS, default the spherically averaged electron density of the atoms is subtracted from the molecular density. However some atoms have a groundstate that strongly deviates from the spherical symmetry. Oxygen for example has a 3P ground state, characterised by one direction in which 2 electrons participate and two perpendicular directions in which 1 electron each participates, this might be termed as an oval symmetry. If the atoms within the molecule have retained a lot of this oval symmetry, then subtracting spherically averaged atoms would result in subtracting too little (4/3 electrons) in the direction in which 2 electrons participate and too much(4/3 electrons) in the directions in which 1 electron each participate. The latter are the directions in which oxygen will form bonds and the overall result would be a seemingly decrease of electron density along the bond axes (See FIGURE 5, the planar conformation of Hydrogen Peroxide).
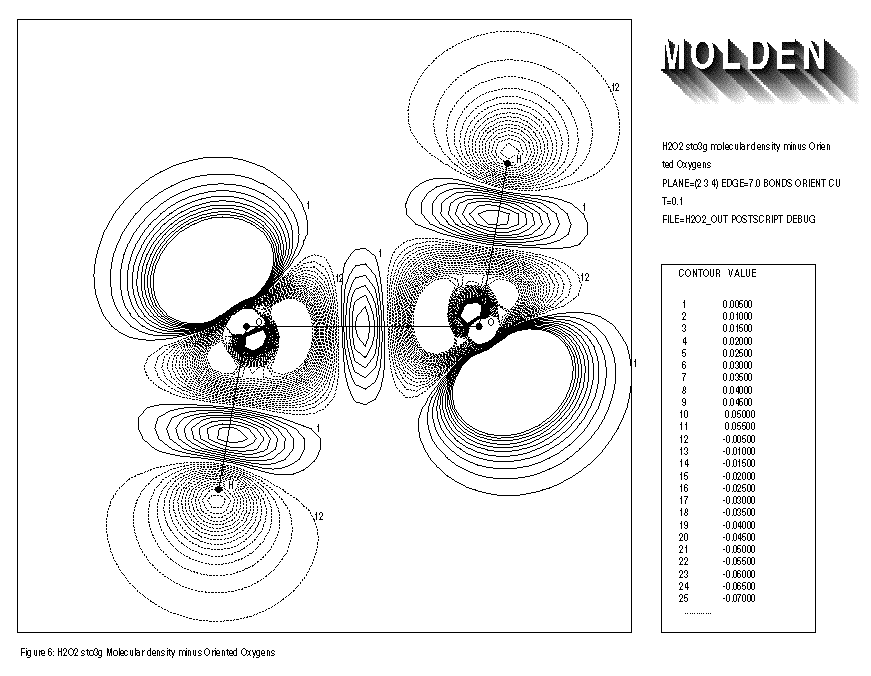
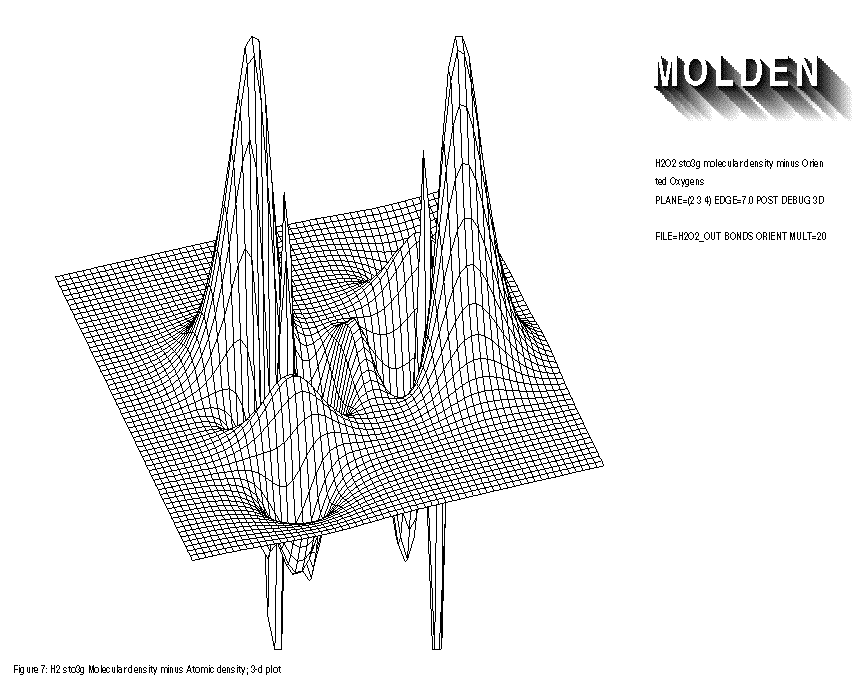
By using the keyword ORIENT, the true atomic ground state density, after optimising its orientation within the molecule, is subtracted from the molecular density. This leads to the expected increase in electron density along the O-O axis in Hydrogen Peroxide (see FIGURE 6 and FIGURE 7)
Inputfile:
1: H2O2 sto3g Molecular Density minus Spherical atoms 2: PLANE=(2,3,4) EDGE=7.0 BONDS CUT=0.1 3: FILE=h2o2out POSTSCRIPT DEBUG
Inputfile:
1: H2O2 sto3g Molecular Density minus Oriented Oxygens 2: PLANE=(2,3,4) EDGE=7.0 BONDS ORIENT CUT=0.1 3: FILE=h2o2out POSTSCRIPT DEBUG
Inputfile:
1: H2O2 sto3g Molecular Density minus Oriented Oxygens 2: PLANE=(2,3,4) EDGE=7.0 POST DEBUG 3D 3: FILE=h2o2out BONDS ORIENT MULT=20
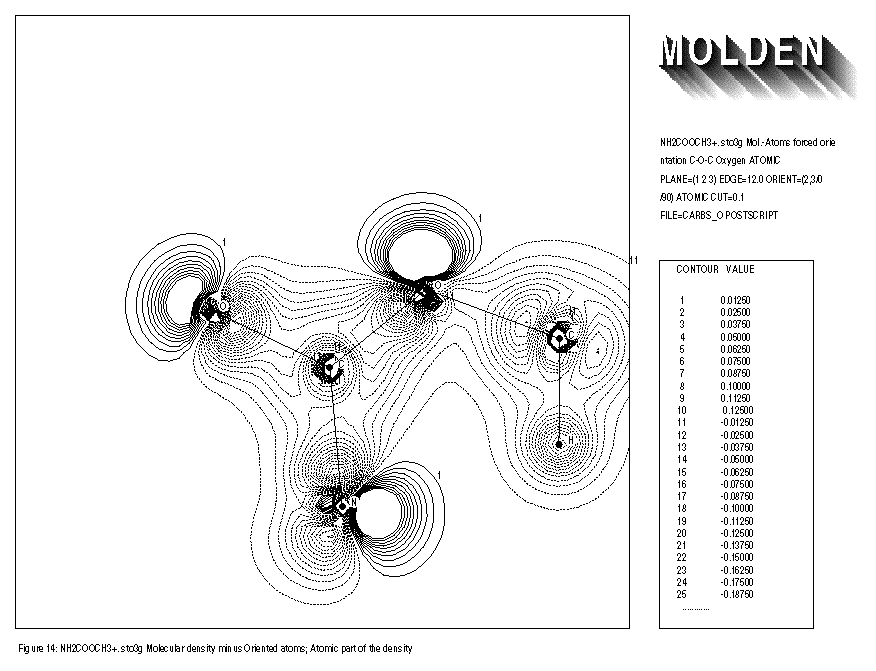
MORE ON THE USE OF THE KEYWORDS BONDS, ORIENT, ATOMIC AND OVERLAP
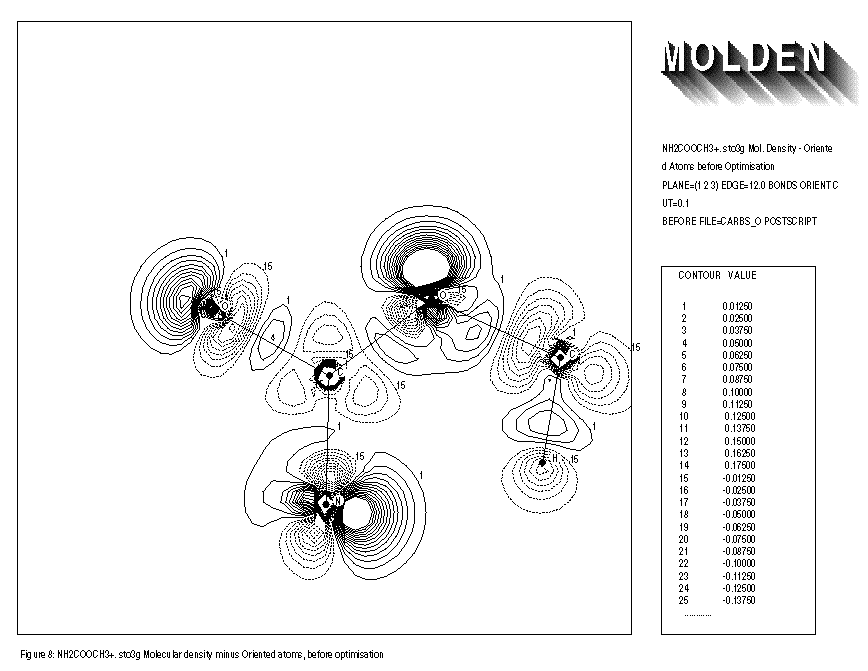
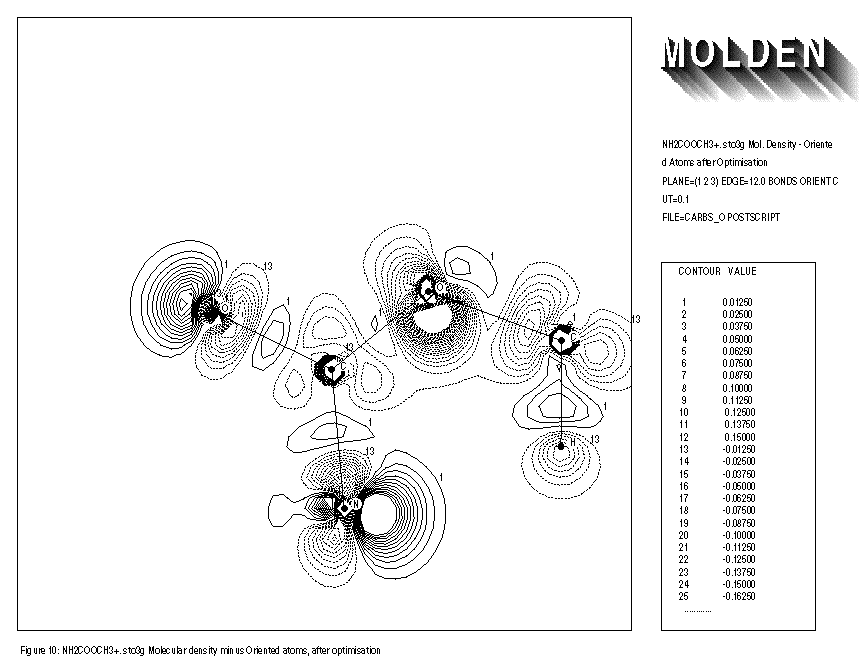
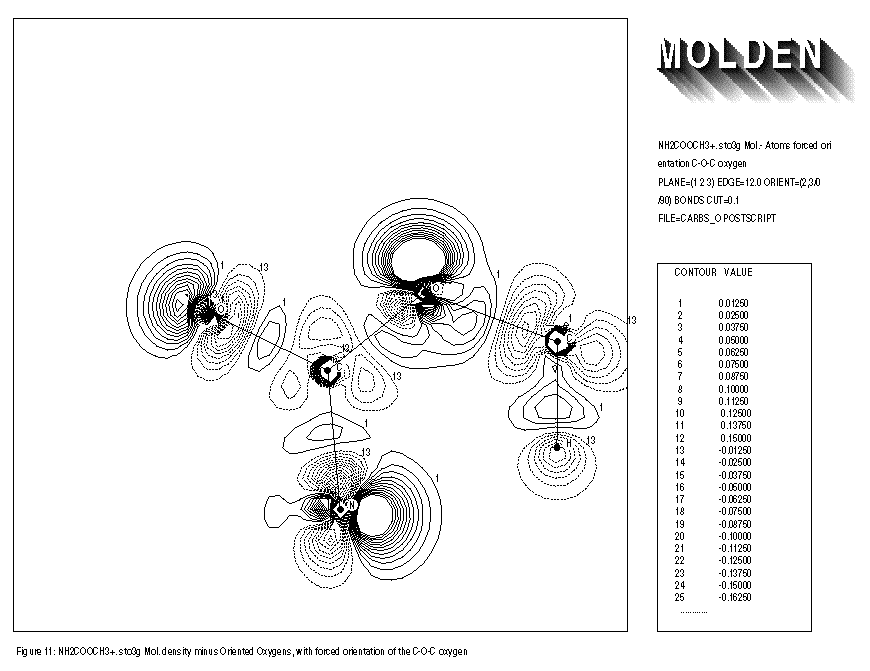
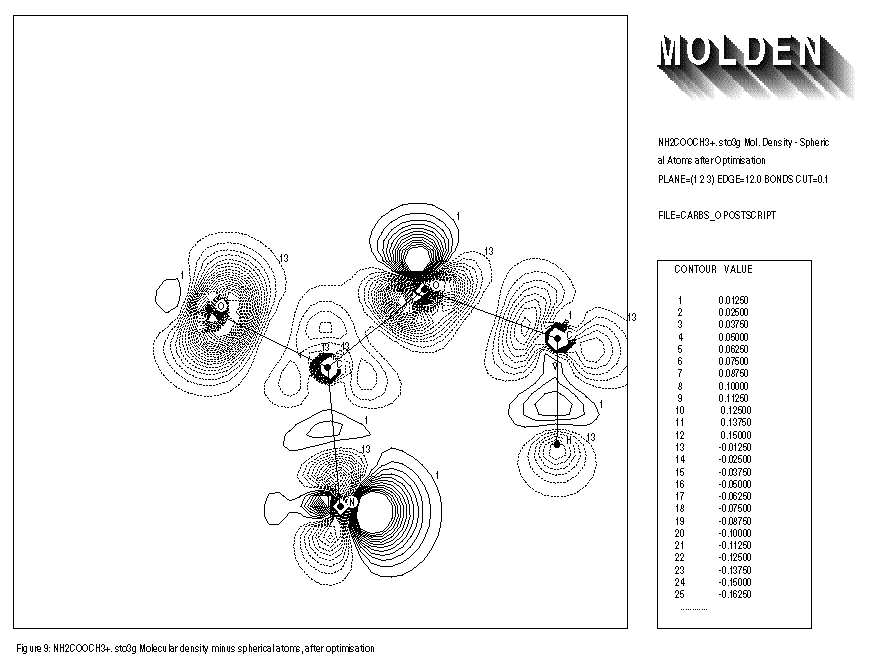
The use of the keywords BONDS,ORIENT,ATOMIC and OVERLAP is illustrated for the NH2COOCH3+.. molecule. Removing an electron from the neutral species results in an extra distortion of the atomic contribution to the molecular density. Before the geometry optimisation of this molecule, the automatic orientation mechanism of ORIENT provides a chemically sensible orientation for both oxygens (See FIGURE 8). After the geometry optimisation however, the automatic orientation mechanism fails for the second oxygen, resulting in a decrease in electron density along the C-O-C axes (See FIGURE 10). Looking at the part of the density matrix involving Px,Py and Pz orbitals of the oxygens, it is clear to see why. For the first oxygen the p-part of the density matrix resembles that of the oxygen ground state. For the second oxygen we see a heavily distorted oxygen ground state (this is reflected in a larger value of delta squared). Where the oxygen ground state has one direction in which 2 electrons participate and two perpendicular directions where 1 electron each participate. The second oxygen has one direction in which roughly 1 electron participates (the y direction) and 2 perpendicular directions in which roughly 1.5 electrons each participate (the x and z directions). The automatic orientation mechanism now will try to align the unique atomic ground state axis with one of the 1.5 electrons axes in the molecule, after the geometry optimisation the balance topples over in favour of the x-direction. By forcing the unique axis to lie in the z-direction, a chemically sensible picture re-emerges in which an increase of electron density midway the C-O-C bond axes can be seen (See FIGURE 11).
FIGURE 8: MOLECULAR DENSITY MINUS ORIENTED GROUNDSTATE ATOMIC DENSITY
- Before geometry optimisation
Inputfile:
1: NH2COOCH3+. sto3g Mol. Density - Oriented Atoms before Optimisation 2: PLANE=(1,2,3) EDGE=12.0 BONDS ORIENT CUT=0.1 3: BEFORE FILE=carbso POSTSCRIPT
Excerpt from the MOLDEN outputfile:
---- O sto3g ----------------------------------------- p-part atomic density matrix before orientation 2.0000 0.0000 0.0000 0.0000 1.0000 0.0000 0.0000 0.0000 1.0000 delta squared = 8.092850549116692E-002 alfa optimised = 0. beta optimised = 90.0000000000000 p-part molecular density matrix 0.9728 0.0184 0.0000 0.0184 0.9900 0.0000 0.0000 0.0000 1.7182 p-part oriented atomic density matrix 1.0000 0.0000 0.0000 0.0000 1.0000 0.0000 0.0000 0.0000 2.0000 ---- O sto3g The C-O-C Oxygen -------------------------- p-part atomic density matrix before orientation 2.0000 0.0000 0.0000 0.0000 1.0000 0.0000 0.0000 0.0000 1.0000 delta squared = 0.486484885670038 alfa optimised = 0. beta optimised = 90.0000000000000 p-part molecular density matrix 1.4122 -0.1816 0.0000 -0.1816 0.8539 0.0000 0.0000 0.0000 1.5212 p-part oriented atomic density matrix 1.0000 0.0000 0.0000 0.0000 1.0000 0.0000 0.0000 0.0000 2.0000
FIGURE 9: MOLECULAR DENSITY MINUS SPHERICALLY AVERAGED ATOMIC DENSITY
- After geometry optimisation
Inputfile:
1: NH2COOCH3+. sto3g Mol.Density - Spherical Atoms after Optimisation 2: PLANE=(1,2,3) EDGE=12.0 BONDS CUT=0.1 3: FILE=carbso POSTSCRIPT
FIGURE 10: MOLECULAR DENSITY MINUS ORIENTED GROUNDSTATE ATOMIC DENSITY
- After geometry optimisation
Inputfile:
1: NH2COOCH3+. sto3g Mol. Density - Oriented Atoms after Optimisation 2: PLANE=(1,2,3) EDGE=12.0 BONDS ORIENT CUT=0.1 3: FILE=carbso POSTSCRIPT
Excerpt from the MOLDEN outputfile:
---- O sto3g --------------------------------------------- p-part atomic density matrix before orientation 2.0000 0.0000 0.0000 0.0000 1.0000 0.0000 0.0000 0.0000 1.0000 delta squared = 7.890606938493698E-002 alfa optimised = 0. beta optimised = 90.0000000000000 p-part molecular density matrix 0.9712 0.0198 0.0000 0.0198 0.9809 0.0000 0.0000 0.0000 1.7226 p-part oriented atomic density matrix 1.0000 0.0000 0.0000 0.0000 1.0000 0.0000 0.0000 0.0000 2.0000 ---- O sto3g The C-O-C Oxygen --------------------------- p-part atomic density matrix before orientation 2.0000 0.0000 0.0000 0.0000 1.0000 0.0000 0.0000 0.0000 1.0000 delta squared = 0.517238577646048 alfa optimised = 18.3000000000000 beta optimised = 180.000000000000 p-part molecular density matrix 1.4285 -0.2000 0.0000 -0.2000 0.8900 0.0000 0.0000 0.0000 1.4804 p-part oriented atomic density matrix 1.9014 -0.2981 0.0000 -0.2981 1.0986 0.0000 0.0000 0.0000 1.0000
FIGURE 11: FORCED ORIENTATION OF THE SECOND OXYGEN
- AFTER GEOMETRY OPTIMISATION
Inputfile:
1: NH2COOCH3+. sto3g Mol. - Atoms forced orientation C-O-C oxygen 2: PLANE=(1,2,3) EDGE=12.0 ORIENT=(2,3/0/90) BONDS CUT=0.1 3: FILE=carbso POSTSCRIPT DEBUG
Excerpt from the MOLDEN outputfile: ---- O sto3g The C-O-C Oxygen -------------------------- p-part atomic density matrix before orientation 2.0000 0.0000 0.0000 0.0000 1.0000 0.0000 0.0000 0.0000 1.0000 delta squared = 0.545626478874887 alfa optimised = 0. beta optimised = 90.0000000000000 p-part molecular density matrix 1.4285 -0.2000 0.0000 -0.2000 0.8900 0.0000 0.0000 0.0000 1.4804 p-part oriented atomic density matrix 1.0000 0.0000 0.0000 0.0000 1.0000 0.0000 0.0000 0.0000 2.0000
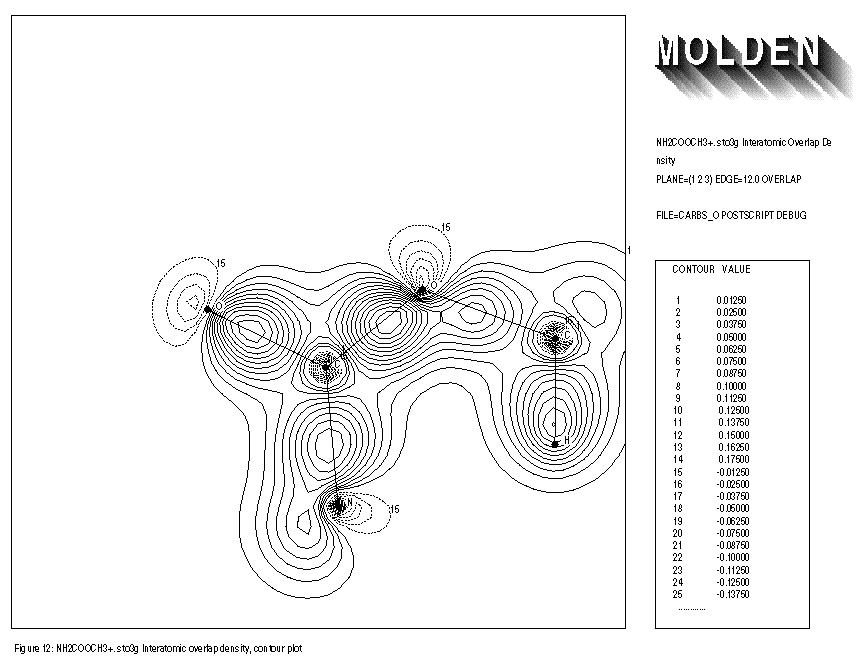
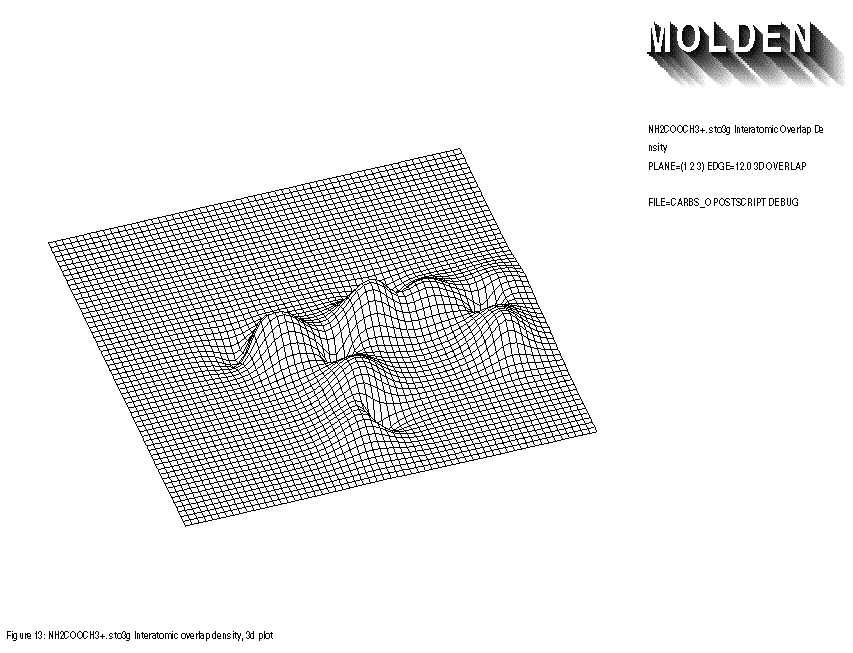
INTERATOMIC OVERLAP PLOTS
FIGURE 12: INTERATOMIC OVERLAP CONTOUR PLOT
Inputfile:
1: sto3g NH2COOCH3+. Interatomic Overlap Density 2: PLANE=(1,2,3) EDGE=12.0 OVERLAP 3: FILE=carbso POSTSCRIPT DEBUG
FIGURE 13: INTERATOMIC OVERLAP 3-D PLOT
Inputfile:
1: sto3g NH2COOCH3+. 2: PLANE=(1,2,3) EDGE=12.0 3D POSTSCRIPT DEBUG 3: FILE=carbso OVERLAP
ATOMIC DEFORMATION
- Molecular density minus oriented groundstate Atomic density - ATOMIC deformation only - Forced Orientation of second Oxygen - After Geometry Optimisation
Inputfile:
1: NH2COOCH3+. sto3g Mol.- Atoms forced orientation C-O-C Oxygen Atomic 2: PLANE=(1,2,3) EDGE=12.0 BONDS CUT=0.1 3: FILE=carbso POSTSCRIPT ORIENT=(3,3/0/90) ATOMIC
specification of BONDS is not necessary when using keyword ATOMIC.
ESP_FITTED_CHARGES
Calculation of ESP charges with Molden
Molden allows the calculation of charges fitted to the ElectroStatic Potential (ESP) on a series of connolly surfaces. (gamess/gaussian only). EXAMPLE:
molden esp.test > esp.out
Where the contents of the file esp.test would be:
esp test file = gaussian.test espch ptden=4.0 debug
Relevant keywords are:
KEYWORDS: Default ESPCH triggers calculation esp charges DMACH triggers calculation DMA derived charges CHADD read non-atomic charge centers from file "molden.def" NUMSURF=n the number of connolly surfaces (4) CONNSC=n.n initial scalefactor vdwaals radii (1.4) CONNINCR=n.n increment scalefactor for next surface (0.2) PTDEN=n.n Density of points per Unit Area (3.0) ISODEN=(isoval1,isoval2,isoval3) ISODEN Fit the electrostatic potential on (3) isodensity surfaces DIPX=n.n specifies dipole moment to be fitted to DIPY=n.n specifies dipole moment to be fitted to DIPZ=n.n specifies dipole moment to be fitted to ARESP write out inputfiles for the RESP program The default is not to fit the dipole moment When constructing the atomspheres which make up the connolly surface, use as principle axis : (sometimes necessary when you want to reproduce symmetry) AXIS-X,AXIS-Y,AXIS-Z AXIS-Z
After BESLER,MERZ,KOLLMAN J. COMPUT. CHEM. 11: 431-439; 1990
MPFIT triggers calculation of multipoles Fit to the DMA derived or Ab Initio calculated electrostatic potential Only available when molden was compiled with 'make molden.mpfit' Keywords available with MPFIT: MPTOL MPEQUIV ATPOL MPTOL=N.NN Singular Value decomposition tolerance (default 1D-5) ATPOL=(atnum1/icode,atnum2-atnum10/icode,...) icode = +1 (if monopole) +2 (if dipole) +4 (if quadrupole) MPEQUIV=()var1,var2,var3/var4,var5/... Equivalences can be set for groups of atoms. Note that equivalences are set in variable numbers, not in atom number; these will differ when dipoles, quadrupoles are used. examp: if atom 1=M+D+Q, then charge on atom 2 has variable number 10
MAPPING THE ELECTROSTATIC POTENTIAL ONTO AN ISODENSITY SURFACE
Mapping the Electrostatic Potential onto an isodensity surface
You can do this interactively via the Xwindows interface, but if you want to do this via a keywords file you should do this by supplying two Gaussian Cube files, one containing the electron density, the other the electrostatic potential. Currently only VRML2.0 output is supported (via keywords).
EXAMPLE:
molden mol.input > mol.out
Where the contents of the file mol.input would be:
some title GAUCUB=meto_dens.cube MAPFIL=meto_esp.cube VRML2.0 SPACE=0.001 MAPVAL=(-0.3,-0.1,0.0,0.1,0.3)
Relevant keywords are:
KEYWORDS: Default
GAUCUB=filename Gaussian cube containing the density
MAPFIL=filename Gaussian cube containing the property
MAPVAL=(val1,val2,val3,val4,val5)
used to change the default property values associated
with the 5 basic colors used for interpolation
This keyword is NOT required.
(default values: (-0.1,-0.05,0.0,0.05,0.1))
GENERATION OF INTERACTIVE SPECTRA FOR THE WORLD WIDE WEB
Generation of interactive spectra in HTML form
SPECTRUM PLECTRUM
Keywords SPECTRUM (and PLECTRUM) trigger the calculation of postscript
file 'spec.ps' from a molden commandfile. Only for those files that carry
pre-calculated QM/semi-empirical spectra information.
The molden keyword PLECTRUM calculates a spectrum for files that have
frequency and intensity information, in addition it converts the
postscript file that contains the spectrum to a jpg file.
For the conversion to work the ghostscript program must be installed
and defined. The folowing command is used to generate spec.jpg:
gs -sDEVICE=jpeggray -r1000x500 -dBATCH -dNOPAUSE -sOutputFile=spec.jpg spec.ps
It also creates the files index.html, mol.xyz and freq???.xyz.
The last files contain animations of the normal modes. These can be used
for interactive spectra in combination with the jmol viewer.
The index.html file now also contains javascript code to view the
active normal mode as a red line drawn on the spectrum.
It also contains a table of available frequencies together with intensities,
they can be clicked to bring up the corresponding normal mode.
FRMUL=N.NN
Specifies a multiplication factor for the amplitude of the normal vibrations.
CALCULATION OF POLAR SURFACE AREA BY CALCULATING
THE AB INITIO OR DISTRIBUTED MULTIPOLE DERIVED ELECTROSTATIC POTENTIAL
MAPPED ONTO AN ISODENSITY SURFACE AND
SUMMING THE SURFACE WITH POTENTIALS DEFINED AS POLAR AND APOLAR
Calculation of QM or DMA Polar Surface Area (QMPSA, DMAPSA)
Step #1: Example of command file for calculation of Distributed Multipole
Derived Electrostatic potential:
atenolol
file=atenolol+H_631g.out space=0.01 wrbas molpot
center=3 edge=36 extnegnh4=(42,15,2.281)
At the end of the calculation a file called '3dgridfile' will have
been created containing the electrostatic potential for each grid point.
Rename the file to 'atenolol+H_631g.3dgriddma'.
Step #2: Example of command file for calculation of the Electron Density:
atenolol
file=atenolol+H_631g.out space=0.01 wrbas dens
center=3 edge=36
At the end of the calculation a file called '3dgridfile' will have
been created containing the electron density for each grid point.
Rename the file to 'atenolol+H_631g.3dgrid'.
Step #3: Read in the electron density grid, by starting molden,
goto 'Density Mode' -> 'Read Grid' -> 'Replace Grid' -> click the
name of the electron density file: 'atenolol+H_631g.3dgrid'
Step #4: Map the electrotatic potential grid,
click the 'Vr' icon -> 'Color Mapped' -> 'Map File:" ->
select the name of the electrostatic potential file: 'atenolol+H_631g.3dgriddma'
Finally click "Apply' to calculate the Polar Surface Area.
Step #5: steps 3 and 4 can also be accomplished by a command file:
atenolol
file=atenolol+H_631g.out RDBAS=atenolol+H_631g.3dgrid
MAPFIL=atenolol+H_631g.3dgriddma POLLOW=-0.075 POLUP=0.100 space=0.01
Keywords pertaining to the calculation of the Polar Surface Area:
EXTPOSCOO=(atom1#,atom2#,dist)
EXTNEGNH4=(atom1#,atom2#,dist)
Add positive (EXTPOSCOO) or negative (EXTNEGNH4) charge at distance 'dist'
from 'atom1#' along the line connecting atom1# and atom2#.
In the case of EXTPOSCOO, atom1# should be the Carbon of the COO group
and atom2# should be the atom that connects the COO group to the rest of
the molecule.
In the case of EXTNEGNH4, atom1# should be the Nitrogen of the NH4 group
and atom2# should be the atom that connects the NH4 group to the rest of
the molecule
EXTPOSCHG=(N.NN,N.NN,N.NN)
EXTNEGCHG=(N.NN,N.NN,N.NN)
keywords EXTPOSCHG and EXTNEGCHG which specify the coordinates of a
single pointcharge to be added for the calculating of the QM
electrostatic potential. This can be used to model a counter charge
when calculating the Elec. Pot. of an anion or cation.
Cartesian coordinates are expected in Bohr.
POLUP=(N.NN)
POLLOW=(N.NN)
POLUP and POLLOW specify the upper and lower limits of the electrostatic
potential treated as polar. The use of these keywords also triggers the
calculation of the Polar Surface Area.
(Default: POLUP=0.115 POLLOW=-0.028)
The default are values optimised for use with QM electrostatic potential
(keyword: ELPO)
When using with the DMA derived electrostatic potential (keyword: MOLPOT),
the following values are recommended:
POLUP=0.085 POLLOW=-0.070
CONVERSION OF INPUTFILES TO VARIOUS OUTPUT FORMATS
Conversion of inputfiles to various output formats
WRZMAT=1-3 Converts an input file to a Z-matrix: (output file name: zmat.out) 1 = Gamess Z-matrix 2 = Gaussian Z-matrix 3 = Mopac Z-matrix WRXYZ=1-12 Converts input file to one of the following cartesian file formats (output file name: mol.xyz) 0 xyz file 1 mol file 2 msf file 3 tinker xyz file 4 '' '' 5 pdb file 6 chemx format 7 msi format 8 molden format file 9 mol2 file 11 ambfor xyz file 12 mopac xyz input file Sample molden command file: title line file=any_input_file wrxyz=11 This will write a ambfor xyz file. As input you could specify a pdb file. The ambfor xyz file, will have hydrogens added, incomplete residues corrected and charges and hydrogens added to ligands and water molecules. WRTAUTO=1-12 Generates enol tautomers from keto forms and writes them as tau01.xyz, tauto02.xyz etc. Possibly also double tautomers tauto0102.xyz Output possible in different formats. 0 xyz file 1 mol file 2 msf file 3 tinker xyz file 4 '' '' 5 pdb file 6 chemx format 7 msi format 8 molden format file 9 mol2 file 11 ambfor xyz file 12 mopac xyz input file WRMOPXYZ Writes an mopac xyz input file. Equivalent to wrxyz=12 WRMOLF Writes an Molden Format file. Equivalent to wrxyz=8 CHARGE=+/-N Specifies a total charge for the molecule to be written in conjuction with the WRXYZ and WRTAUTO keywords.