Recursive partitioning
Contents |
In statistics, recursive partitioning is a method for the multivariable analysis of diagnostic tests.[1][2][3]. Recursive partitioning creates a decision tree that strives to correctly classify members of the population based on a dichotomous dependent variable. Compared to other multivariable:
- Advantages are:
- Generates clinically more intuitive models that do not require the user to perform calculations.[4]
- Allows "adjustable misclassification penalties" or misclassification costs in order to create a decision rule that has more sensitivity or specificity. This has also been called the "diversity index" which is the sum of the false-negatives and false-positives. Either the false-negatives and false-positives can be weighted in order to preferentially reduce their occurrence.[5][6]
- Disadvantages are:
- Does not work well for continuous variables[7]
- May overfit data.
Studies comparing the predictive accuracy of recursive partitioning with logistic regression have reported no difference[4], recursive partitioning to be more accurate[8] and logistic regression to be more accurate.[9]
A variation is 'Cox linear recursive partitioning'.[5]
Examples are available of using recursive partitioning in research of diagnostic tests.[9][10][11][12][13][14] Goldman used recursive partitioning to prioritize sensitivity in the diagnosis of myocardial infarction among patients with chest pain in the emergency room.[13]
Additional alternatives to recursive partitioning include latent class analysis.[15][16]
Calculations
Unweighted analysis
An 'Initial misclassification rate' is calculated by assigning all cases to a single class. Using the example in the CART Manual, in trying to diagnose 59 patients who have a disease of interest among a sample of 189 patients, arbitrarily classifying all patients as normal yields:[17]
For the top node, also called node 1:

For the next nodes: The next best independent, classifier variable creates two nodes:
- Left node: 159 patients; 118 have disease and 41 are false positives who do not have the disease
- Right node: 30 patients; 12 have disease and false negatives


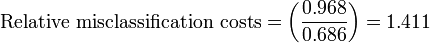
Weighted analysis
In this analysis, the sensitivity is preferenced by weighted it by 2.2, which is the ratio of patients without disease over patients with disease.
For the top node:

For the next nodes: The next best independent, classifier variable creates two nodes:
- Left node: 159 patients; 118 have disease and 41 are false positives who do not have the disease
- Right node: 30 patients; 12 have disease and false negatives

Stopping rules
Various methods have been proposed to avoid overfitting of data.
- One method is to grow the tree as far as possible, then to 'prune' the tree. Pruning is based on a balance between misclassification costs and tree complexity.[2][18]
Another method is to grow the tree "until p<0.05 or until one or more of the marginal counts in the two-by-two table is less than 10."[4]
Software for recursive partitioning
Software available for recursive partitioning includes:
- CART
- R programming language:
- rpart package
- HSAUR2 interactive package with a chapter containing sample demonstrations, "Recursive Partitioning: Predicting Body Fat and Glaucoma Diagnosis" in "A Handbook of Statistical Analyses Using R".[19]
References
- ↑ Breiman, Leo (1984). Classification and Regression Trees. Boca Raton: Chapman & Hall/CRC. ISBN 0-412-04841-8.
- ↑ 2.0 2.1 Lewis RJ (2000). An introduction to classification and regression tree (CART) analysis. Accessed March 12, 2008
- ↑ Yohannes Y, Hoddinott J (1999). Classification and regression trees: an introduction. Accessed March 12, 2008
- ↑ 4.0 4.1 4.2 James KE, White RF, Kraemer HC (2005). "Repeated split sample validation to assess logistic regression and recursive partitioning: an application to the prediction of cognitive impairment". Statistics in medicine 24 (19): 3019-35. DOI:10.1002/sim.2154. PMID 16149128. Research Blogging.
- ↑ 5.0 5.1 Cook EF, Goldman L (1984). "Empiric comparison of multivariate analytic techniques: advantages and disadvantages of recursive partitioning analysis". Journal of chronic diseases 37 (9-10): 721-31. PMID 6501544.
- ↑ Nelson LM, Bloch DA, Longstreth WT, Shi H (March 1998). Recursive partitioning for the identification of disease risk subgroups: a case-control study of subarachnoid hemorrhage. J Clin Epidemiol 51 (3): 199–209. PMID 9495685.
- ↑ Lee JW, Um SH, Lee JB, Mun J, Cho H (2006). "Scoring and staging systems using cox linear regression modeling and recursive partitioning". Methods of information in medicine 45 (1): 37-43. PMID 16482368.
- ↑ Kattan MW, Hess KR, Beck JR (1998). "Experiments to determine whether recursive partitioning (CART) or an artificial neural network overcomes theoretical limitations of Cox proportional hazards regression". Comput. Biomed. Res. 31 (5): 363-73. PMID 9790741.
- ↑ 9.0 9.1 Fonarow GC, Adams KF, Abraham WT, Yancy CW, Boscardin WJ (2005). "Risk stratification for in-hospital mortality in acutely decompensated heart failure: classification and regression tree analysis". JAMA 293 (5): 572-80. DOI:10.1001/jama.293.5.572. PMID 15687312. Research Blogging.
- ↑ Stiell IG, Wells GA, Vandemheen KL, et al (2001). "The Canadian C-spine rule for radiography in alert and stable trauma patients". JAMA 286 (15): 1841-8. PMID 11597285.
- ↑ Haydel MJ, Preston CA, Mills TJ, Luber S, Blaudeau E, DeBlieux PM (2000). "Indications for computed tomography in patients with minor head injury". N. Engl. J. Med. 343 (2): 100-5. PMID 10891517.
- ↑ Stiell IG, Greenberg GH, Wells GA, et al (1996). "Prospective validation of a decision rule for the use of radiography in acute knee injuries". JAMA 275 (8): 611-5. PMID 8594242.
- ↑ 13.0 13.1 Goldman L, Weinberg M, Weisberg M, et al (1982). "A computer-derived protocol to aid in the diagnosis of emergency room patients with acute chest pain". N. Engl. J. Med. 307 (10): 588-96. PMID 7110205.
- ↑ Heikes KE, Eddy DM, Arondekar B, Schlessinger L (May 2008). Diabetes Risk Calculator: a simple tool for detecting undiagnosed diabetes and pre-diabetes. Diabetes Care 31 (5): 1040–5. DOI:10.2337/dc07-1150. PMID 18070993. Research Blogging.
- ↑ McCutcheon AL. Latent Class Analysis. Beverly Hills, CA: Sage Publications; 1987.
- ↑ Schur EA, Afari N, Furberg H, et al (2007). "Feeling bad in more ways than one: comorbidity patterns of medically unexplained and psychiatric conditions". Journal of general internal medicine : official journal of the Society for Research and Education in Primary Care Internal Medicine 22 (6): 818–21. DOI:10.1007/s11606-007-0140-5. PMID 17503107. Research Blogging.
- ↑ Steinberg, Dan and Phillip Colla. (1995). CART: Tree-Structured Non- Parametric Data Analysis. San Diego, CA: Salford Systems, 39.
- ↑ Yohannes Y, Hoddinott J (1999). Classification and regression trees: an introduction. Accessed March 12, 2008
- ↑ Torsten Hothorn; Everitt, Brian. CRAN - Package HSAUR, 2nd ed.
External links
| |
Some content on this page may previously have appeared on Citizendium. |